EU Wind and Solar Saved EUR 72 Billion in Fossil Fuel Import CostsEU Wind and Solar Saved EUR 72 Billion in Fossil Fuel Import CostsEU Wind and Solar Saved EUR 72 Billion in Fossil Fuel Import CostsEU Wind and Solar Saved EUR 72 Billion in Fossil Fuel Import Costs
August 6, 2026
New wind and solar capacity built across the European Union avoided EUR 72 billion in fossil fuel import costs between 2022 and 2025, according to Ember analysis cited in the 75th edition of the Statistical Review of World Energy. The forcing function for what became the fastest
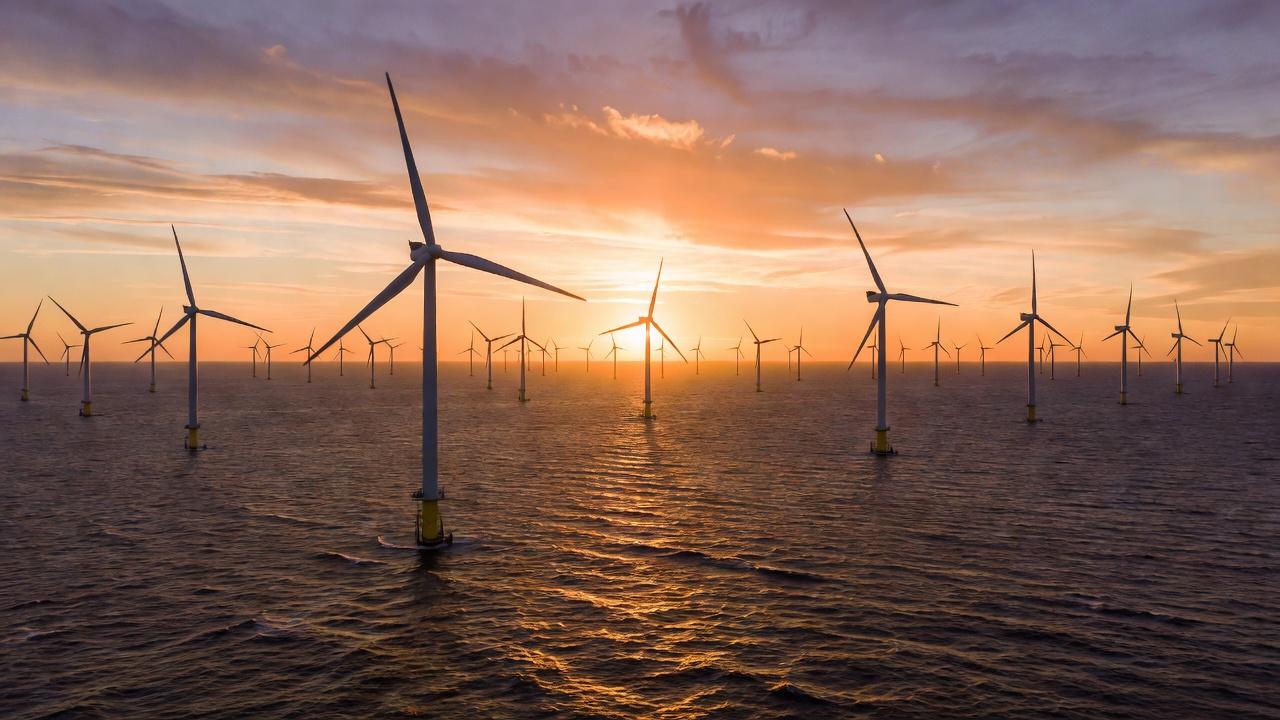
New wind and solar capacity built across the European Union avoided EUR 72 billion in fossil fuel import costs between 2022 and 2025, according to Ember analysis cited in the 75th edition of the Statistical Review of World Energy. The forcing function for what became the fastest renewable energy buildout in EU history was not a technology breakthrough or a carbon price signal: it was Russia's invasion of Ukraine in early 2022. The data now confirm that the transition delivered measurable fiscal returns within a single four-year budget window.
What's New
The 75th edition of the Statistical Review of World Energy, released in 2026, documents a structural shift in European electricity supply that has no modern precedent in speed or scale. Wind and solar together supplied 30% of EU electricity in 2025, up from 19% in 2021. That 11-percentage-point gain compressed into four years represents a deployment acceleration that pre-2022 forecasters had not modeled for this decade.
The review's key savings chart draws on Ember's analysis to put a euro figure on that acceleration. The EUR 72 billion in avoided fossil fuel import costs accrued across 2022 through 2025, with Germany, Spain, and Italy accounting for the largest national shares. The Statistical Review does not publish a per-country breakdown, but the identification of those three economies as primary beneficiaries aligns with their size and relative dependence on imported gas before 2022.
The report attributes the buildout in part to REPowerEU, the European Commission's emergency policy program adopted in May 2022 in direct response to the Russian invasion, which aimed to accelerate renewables deployment and reduce EU dependence on Russian energy imports.
How It Works
Every terawatt-hour (TWh) of electricity generated by wind or solar displaces a terawatt-hour that would otherwise have been generated by burning imported natural gas, coal, or oil. Because fuel-price exposure sits inside the generation cost of a gas plant but not inside the generation cost of a wind or solar plant, scaling renewables functions as a structural hedge against import price volatility.
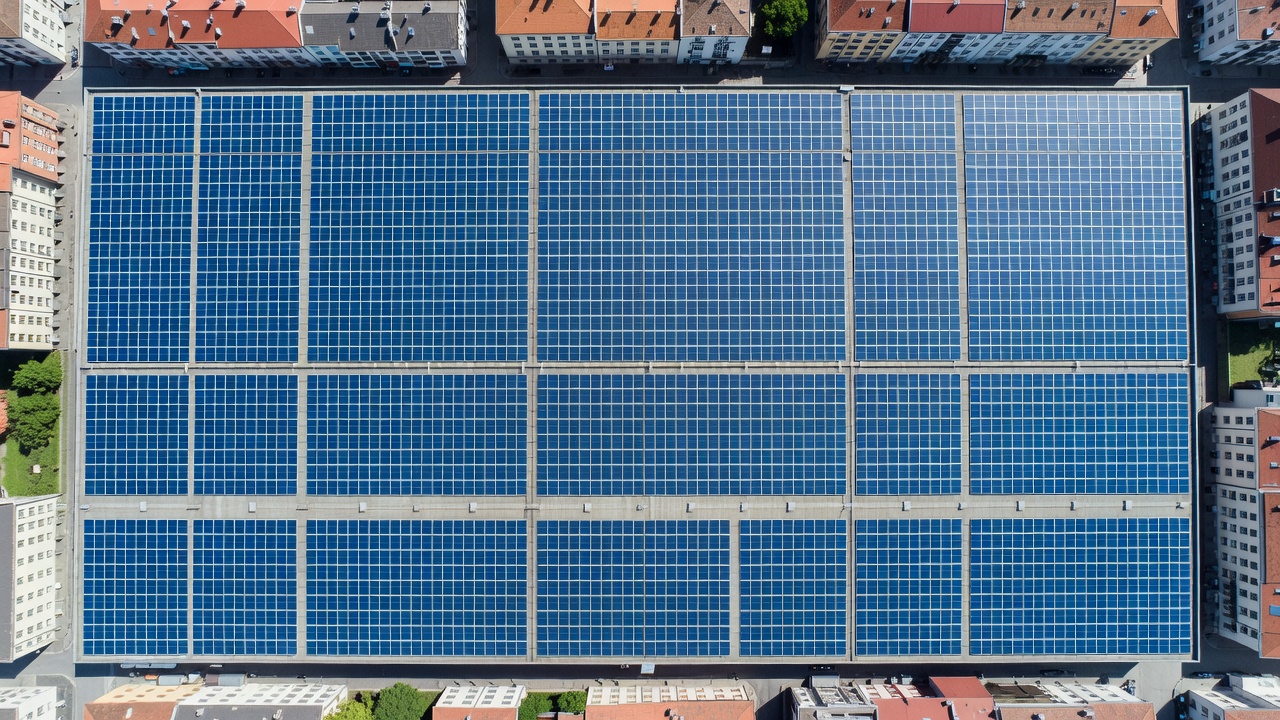
The scale of that displacement is now visible in the generation mix data. EU wind and solar combined produced 852 TWh in 2025. Coal, gas, and oil combined produced 760 TWh across the same year. Renewables now generate more EU electricity than all fossil fuels combined. Gas generation fell 15% between 2021 and 2025; coal generation fell 38% over the same period.
The majority of the EUR 72 billion in avoided costs came through reduced gas imports, reflecting the EU's pre-2022 fossil fuel mix: gas was the dominant marginal fuel in power generation and the commodity most exposed to Russian supply disruption. Before 2022, Russia reportedly supplied a substantial share of EU natural gas imports. Germany, the EU's largest economy and largest gas consumer, had limited LNG import terminal capacity, meaning pipeline gas had no near-term substitute at scale.
The Nord Stream pipeline system illustrates the structural exposure. Nord Stream 1 was the primary high-volume delivery route from Russia to Germany. Following the invasion, gas flows through the pipeline were curtailed. Explosions struck the pipelines in late 2022, rendering them inoperable and eliminating the option of restoring pipeline flows even in a diplomatic resolution scenario.
The Economics
The EUR 72 billion figure represents avoided import expenditure, not net savings after capital cost of the renewable buildout. The gross avoided-import metric is nonetheless the relevant fiscal unit for a national energy account: it measures the hard-currency outflow that did not leave the EU economy.
The following table summarises the key quantitative markers from the 2021-to-2025 transition period:
| Metric | 2021 Baseline | 2025 Result | Change |
|---|---|---|---|
| Wind and solar share of EU electricity | 19% | 30% | +11 percentage points |
| EU gas generation | Baseline (2021) | Post-2021 | -15% |
| EU coal generation | Baseline (2021) | Post-2021 | -38% |
| Wind and solar combined output (2025) | N/A | 852 TWh | Exceeds fossil fuel total (760 TWh) |
| Avoided fossil fuel import costs (2022-2025) | N/A | EUR 72 billion | Ember analysis |
The policy framework supporting these numbers includes REPowerEU, adopted by the European Commission in 2022 in direct response to Russia's invasion of Ukraine, and pre-existing decarbonization targets under the European Green Deal. The Ember analysis, cited in the Statistical Review's key savings chart, attributes the EUR 72 billion in avoided costs to new wind and solar capacity deployed in the years immediately following the invasion.
Competitive Landscape
The competitive question here is geopolitical rather than commercial: which economies are fastest to replace fossil fuel import dependence with domestic generation capacity.
The EU's 2021-to-2025 trajectory is the current reference case. The bloc moved wind and solar from 19% to 30% of electricity supply in four years while simultaneously reducing coal generation by 38% and gas generation by 15%. The speed of that adjustment was not forecast before the Ukraine invasion created a political forcing function that overrode the slower timelines embedded in pre-2022 energy planning.
The key indicators that define the EU's current position include:
- Wind and solar generation (852 TWh in 2025) now exceeds all fossil fuel generation (760 TWh) within the EU electricity system.
- Germany, Spain, and Italy recorded the largest national avoided-import savings within the EU, according to the Ember analysis cited in the Statistical Review.
- REPowerEU, the European Commission's emergency program, was adopted in 2022 to accelerate both renewables deployment and import diversification.
Independent analyst commentary specifically on this announcement was not publicly available at publication time.
What's Next
The Ember analysis and the Statistical Review establish 2025 as the year EU wind and solar output crossed the 852 TWh threshold, surpassing combined fossil fuel generation of 760 TWh. The next planning horizon is shaped by REPowerEU targets and the EU's stated ambition to reduce remaining Russian energy imports, though specific timelines for those future milestones remain subject to legislative and geopolitical developments not fully resolved at publication time.
Germany, Spain, and Italy, identified as the three largest beneficiaries of the avoided-import savings, each carry different energy mixes and import profiles going forward. Germany's prior dependence on Russian pipeline gas and its limited LNG infrastructure before 2022 make its trajectory the most structurally significant of the three: the pipeline route is now physically closed following the late-2022 explosions, meaning any future supply relationship would require rebuilt infrastructure rather than a political decision alone.
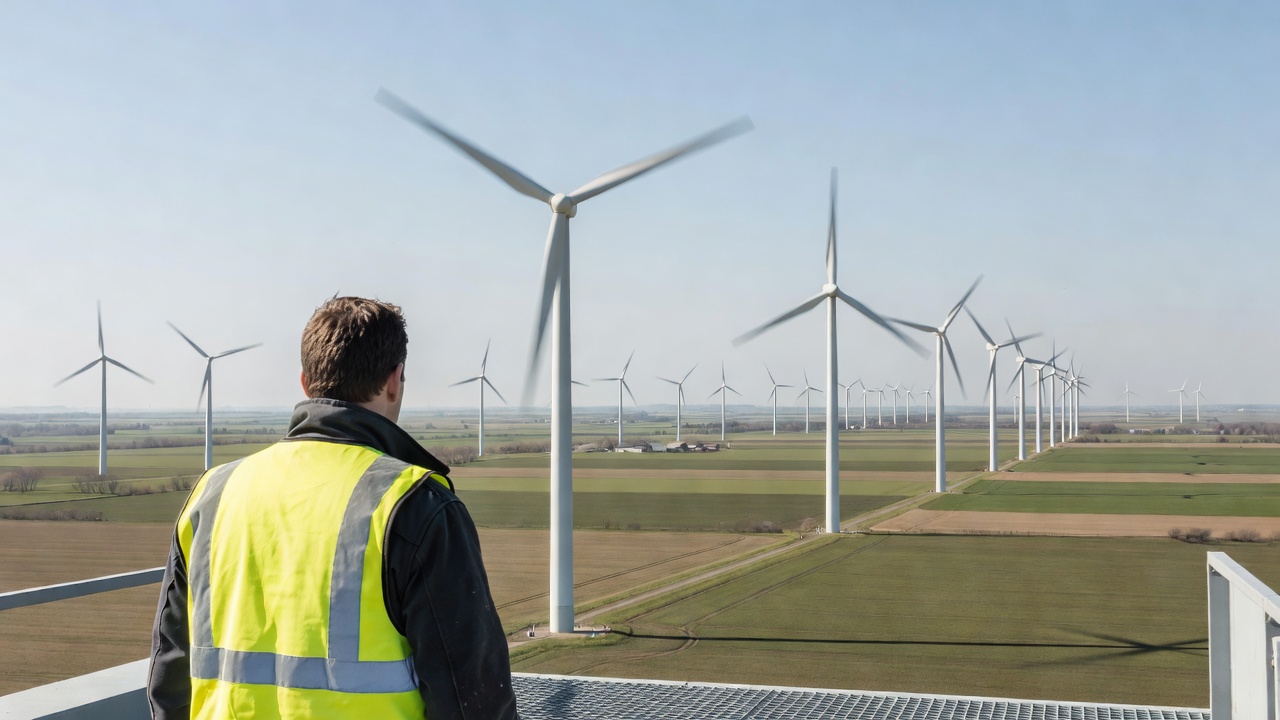
The coal generation decline of 38% between 2021 and 2025 is a separate trend from the gas displacement story. Coal's fall reflects both renewable substitution and pre-existing EU phase-out commitments. The gas decline of 15% over the same period is smaller in percentage terms, in part because gas plays a different role in the grid: it provides dispatchable generation that wind and solar, as variable sources, cannot fully replace without complementary storage or grid flexibility investments.
For policymakers and public-sector energy planners, the Ember analysis provides a validated fiscal baseline: EUR 72 billion in avoided import expenditure across four years, with Germany, Spain, and Italy as the largest national beneficiaries. At 852 TWh of wind and solar output in 2025 versus 760 TWh of combined fossil fuel output, the EU has crossed the generation threshold. The next planning cycle should account for the REPowerEU program's targets and the structural closure of the Nord Stream pipeline route, using avoided-import metrics to identify the highest-return remaining deployment corridors.
The most durable finding is not the EUR 72 billion headline. It is that the fastest energy transition in EU history was underwritten not by falling technology costs or carbon pricing alone, but by a geopolitical shock that made the status quo more expensive than the alternative. The EU did not choose speed; speed was imposed. The question for the remainder of this decade is whether the institutional capacity built under crisis conditions can be sustained under normal political conditions, when the urgency has faded but the targets have not.
-- Aria Lin, Enterprise Technology Analyst
Sources: Statistical Review of World Energy (75th edition); Ember (analysis cited in the Statistical Review); CleanTechnica, August 5, 2026